USA's annual money growth exceeds 25%, the highest in its modern peacetime history
posted by Tim Congdon on June 10, 2020 - 12:00am
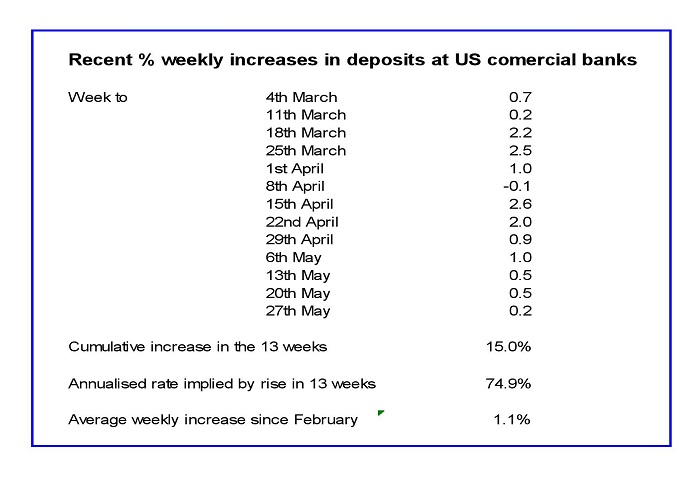
Last Friday the Federal Reserve published another week of data on the US commercial banks’ assets and liabilities, completing the month of May. Deposits rose by 0.2% in the week to 27th May, so that the sequence of weeks since the start of March is as given in the table below.
The latest figures enable the analyst to estimate the increase in bank deposits between March and April. In the USA the monthly change in a money aggregate is derived by comparing the average of the weekly values in one month with the average in the previous month. On this basis the increase in deposits between February and March was 2.6%, between March and April 6.6%, and between April and May 4.7%. Bank deposits are not the only constituent of the quantity of money, broadly defined, but they dominate it.
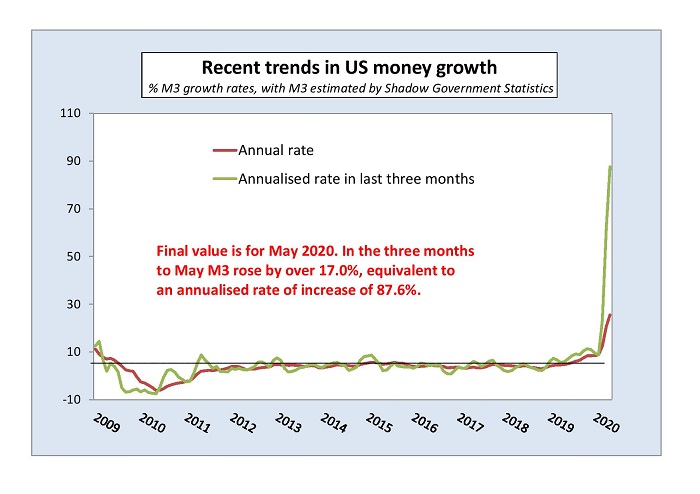
Shadow Government Statistics (SGS) has published an estimate of the increases in M3 in the three months, coming up with figure of 4.0%, 7.7% and 4.5% for March, April and May respectively. (The March and April numbers have been revised upwards slightly in the latest SGS release.) As noted here in a special e-mail of 11th May, the main difference between bank deposits and M3 is that M3 also includes money market mutual funds. These are held disproportionately by financial institutions and large corporates. It does in fact make sense that the Shadow Government Statistics’ figure for M3 is higher than mine (obtained from Fed data) for bank deposits. The explanation is that the MMMF balances would have been boosted, in marked fashion, by Fed asset purchases – i.e., “quantitative easing” – directed at the financial sector in the first instance. At any rate, the numbers from Shadow Government Statistics give an increase in the quantity of money for the three months of 17.0%. The implied annualised rate of increase is 87.7%, rather more than for bank deposits by themselves (i.e., 74.9%, as in the table above).
In the year to May the M3 measure of money – which corresponds to the M2 measure favoured by Milton Friedman and Anna Schwartz in their 1963 A Monetary History of the United States – increased by just over 25.5%. This was the highest increase in the quantity of money in modern American peacetime history.
(There is little doubt that it was the highest figure in modern American peacetime history, startling thought this proposition may be. For the M2 aggregate, a very high figure of 19% was recorded in 1919, just after the First World War, but otherwise the inter-war period was in the first quarter of 1935, at over 15%. In the post-war period local peaks were recorded in 1971, at 16.4%, and in 2008, at 15.1%. The 1971 peak coincided with a bull market in stocks, which was in fact much stronger in 1972; it came ahead of a big boom in the economy and was in a period of high underlying inflation. The 2008 value was largely because financial business left the shadow banks and re-appeared in the mainstream Fed-regulated banking system tracked in the money aggregate data. Note that the M2 measure now published by the Fed has become misleading, because it excludes deposits with an initial value of over $100,000, and hence the bulk of money balances held by the corporate sector. The Fed’s current M2 is therefore not the M2 concept favoured by Friedman and Schwartz in their A Monetary History. The Fed no longer publishes a M3 figure, and has made clear in various announcements that – in its analytical work and prognostications – it more or less ignores all the money aggregates.)
What happens now? A slowdown in money growth to more normal levels is to be expected, but my surmise is that in 2020 it will not be a single-digit annual rate of increase. The table above shows that in the last two weeks of May bank deposits rose on average by just over 0.3%, dramatically lower than in the previous nine weeks, when the average increase was 1.4%. But – if the weekly increase continued at 0.3% for a year – the annual increase would still be almost 17%. A central problem in US monetary control now is the need to limit monetary financing of the budget deficit. In a Presidential election year this will not be a high policy priority. The typical Latin American inflation episodes in the 20th century were characterised by rampant monetary financing of budget deficits, reflecting the myopia of government and central bank actors, and the frailty of political loyalties, as well as rank incompetence. It must be hoped – and it is indeed to be expected – that this sort of thing does not become entrenched in the USA. At one time its political class was a champion of the “old-time religion” of balanced budgets and sound money.
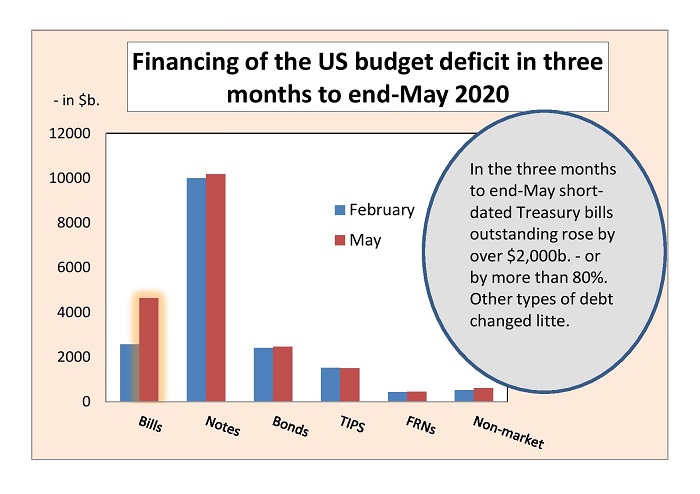
In the three months to May the US public debt grew from $17,413b. to $19,813b., or by $2,400b. This $2,400b. figure was – let it be emphasized – a three-month deficit, not an annual one. Meanwhile the total of Treasury bills in issue soared from $2,564b. to $4,629b., or by $2,065b. Bills have a year or less to maturity. They are the easiest form of financing, since they are so attractive to commercial banks for their liquidity that the banks are prepared to hold them at almost zero yields. In practice, the majority of the issuance of new government paper in this three-month period was taken up by the Federal Reserve and led to increases in banks’ cash reserves. The US Treasury also issues notes, with an initial maturity of between one and ten years, and bonds, with an initial maturity of over ten years, both on a fixed-interest basis, plus Treasury inflation-protected securities (or TIPS). The chart below shows that in the last three months the US Treasury has been heavily dependent on new short-term debt for covering its borrowings. It has accessed finance from bonds, notes and TIPS to only a limited degree.
One medium-term worry has to be that financial markets become anxious about the inflation risks inherent in the current policy direction. Rises in interest rates and bond yields would add to the servicing costs of the rapidly-growing US public debt, so that the increase in interest costs would itself tend to add to public expenditure and hence to future budget deficits. Projections of explosive increases in debt interest costs were behind the Greek public debt crisis of the early 2010s and responsible for the default on its liabilities to the private sector in 2011. Of course, that kind of problem is not imminent for US Treasury debt. On the other hand, the laws of arithmetic apply to debt issued by the USA as well as to debt issued by Greece or any other country.
 The Institute’s recent e-mails on the US fiscal and monetary scene have generated much interest. A couple of replies to the resulting e-mail correspondence may be of wider interest. First, I took part in a debate by blog, on the subject ‘Inflation or Deflation – Which Is the Greater Threat?’, with Professor Macario Schettino from the Technical University of Monterrey on the Pairagraph website
( www.pairagraph.com ) at the invitation of the website’s host, Jonathan Stern. Professor Schettino, a Mexican, cast doubt on my worries that US money growth had recently run at rates similar to those seen in past Latin American inflations.
My contribution - https://www.pairagraph.com/dialogue/3b229f6001f44ab3bdf9990eea7a796a - to the Pairagraph exchange emphasized that the important variable in any inflation prognosis is the quantity of money, broadly-defined, i.e., a money measure dominated by the deposit liabilities of the commercial banking system). The size of either the central bank’s balance sheet or commercial banks’ cash reserves does not have a direct bearing on inflation.
Why? I am enough of a New Keynesian to accept that in the first instance prices are set in product markets, and wages in labour markets, so that the direction of inflation depends largely on the degree of excess demand (or excess supply) in product and labour markets. Transactions in these markets are made by households and companies, while non-money financial assets are managed in investment portfolios by financial institutions. It follows that the money balances held by households, companies and financial institutions are those that are relevant to the determination of inflation, i.e., the money balances that are included in broad money. By contrast, banks do not hold risky assets which fluctuate much in value, while their own expenditure is a tiny fraction of total aggregate demand. So their cash reserves are of very limited importance by themselves in determining macro outcomes. (To the extent that banks’ cash reserves affect the quantity of money, then they matter because of their effect on the quantity of money and – via the quantity of money – on macroeconomic outcomes. But one message of the Great Recession was the quantity of money should not be viewed as a stable multiple of the monetary base.)
The point may seem pedantic, but it is important. Central bank governors have fallen into the bad habit of relating the prospect for the economy to the size of their own institution’s balance sheets. So, for example, contractions in the Fed balance sheet are seen by its current chairman, Jay Powell, as a means of keeping inflation down. But control of the Fed’s own balance sheet is not sufficient for that purpose. The Fed balance sheet could contract, while the quantity of money expands rapidly. If so, the (powerful) impact of the quantity of money on macro- outcomes will dominate the (trivial) effects of changes in the monetary base and/or in banks’ cash reserves by themselves on demand, asset prices and so on. Measures focussed on the central bank balance sheet may well prove ineffective.
My second point is separate, but related. In late 2008 and early 2009 I was a strong advocate of “quantitative easing” (i.e., large-scale purchases of government bonds from non-banks by the state to boost the quantity of money) to overcome the Great Recession, and I was confident that higher inflation would not ensue. By contrast, I am at present vocal in warning that the current sharp acceleration in money growth in the USA and elsewhere, partly due to “quantitative easing”, will be followed by higher inflation. Critics charge that my position is blatantly inconsistent. How can I say that QE will result in more inflation over the next two/three years when little more than a decade ago I denied that QE would have any inflationary impact?
My position is not in the least inconsistent. In the Great Recession I insisted – and today I continue to insist – that the key to understanding the medium-term trend in inflation is to monitor developments in the quantity of money, broadly-defined.
In late 2008 and early 2009 the big problem was that officialdom’s demands for large increases (of over 60%) in banks’ capital/asset ratios were leading to the destruction of money balances, with severe deflationary consequences. In my work – which is very different from, for example, that of Ben Bernanke in the USA and the research department at the Bank of Japan – the purpose of QE was to create new money balances which would keep the overall rate of money growth positive despite the money destruction. That is roughly what happened, and in fact in the USA and UK the QE exercises were beautifully calibrated to deliver money growth of a bit less than 5% a year…Both economies recovered and stabilised, etc.
Today the situation is very different. Banks are not being asked to raise more capital and, on the contrary, capital adequacy rules have been relaxed. (Quite right too in the circumstances.) Particularly in the USA, and to a lesser extent elsewhere, governments have ballooned their budget deficits and financed them from banking systems, creating extra money balances. QE exercises have also been undertaken, with further additions to the quantity of money over and above those due to monetary financing of the budget deficit. The fiscal and monetary sprees have been so huge and permissive that broad money growth rates have risen to extraordinary levels. As I have pointed out above, and about which I have in fact been hinting for some weeks, the USA now has the highest annual growth rate of the quantity of money in its peacetime history. So – unlike late 2008 and early 2009 (and indeed for a few years thereafter) – I am very worried about a sequel in which annual inflation takes off into the double digits, at least in the USA. The chart above speaks for itself.
